Fibonacci Theory
Deaching of the great explorer of the truth the builder
-
INTERMEDIATE LEVEL

-

Fibonacci Theory
What is it?
Fibonacci theory is not one exclusive to Forex. It exists everywhere in nature.

 It is a sequence of numbers and the crowning glory of this whole system is the golden ration; 0.618 or 61.8%. This ratio can be found when analyzing the human body. It exists in structure of molecules. It exists in plants and flowers, in the DNA and everywhere in between.

 There is a lot of information available on this theory so you can look it up if you’re interested. We are mainly concerned with where it enters Forex.
Fibonacci numbers or the Fibonacci sequence, as you may already be aware is a series of numbers that can be calculated using basic maths.

 We start with the regular 0 and 1.
0, 1
If you add these you get 1. So the sequence now goes
0, 1, 1
Add the last two number i.e. (1 and 1) and you get the fourth one.
0, 1, 1, 2
Add the last two now and you get 3 so the sequence goes
0, 1, 1, 2, 3.
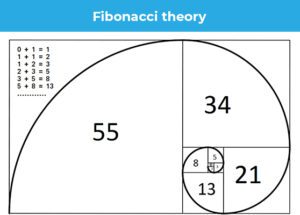
This is how you can go on calculating the Fibonacci sequence for as long as you like and it will look something like
0, 1, 1, 2, 3, 5, 8, 13, 21, 34, 55, 89, 144 and so on.
Furthermore, if you take any of these numbers and divide it by the next high number, you will get .618 in the answer.
This is what is important in Forex and where Fibonacci theory is used. Graphs of currency movements do not go steadily up or down. A price graph in Forex looks jagged. It moves up for a bit, then goes down, and finally up again.

 The part in price action where it falls a bit before going back is called the retracement. This principle implies that the price after reaching a high will retrace it steps back a little before going up again. It’s like a little break or a stop it makes to recharge and then run up ahead.
Why should an fx trader care about the Golden ratio?
Before getting into that a side bit of info here is that in a graph showing either an upward trend, the peak is made up of two lines; the one that moves initially and the one that retraces back. The one that makes the initial movement upwards or downwards is called the Impulse Wave, and the one that retraces its steps back is the Corrective Wave.

 Retracement is important to traders because they want to buy where retracement ends so they can buy low. They want to know the lowest level so they can buy a currency just before it starts to go back up again.
The magical powers of 0.618 or 61.8% are reiterated here often as after the price has retraced 61.8% of the way, it will usually start going up again. So, if a trader goes long at when the price has decreased 61.8%, there is a good probability that it will stop depreciating at that level and instead move up. Now the trader holds a currency that has gained value and so can sell it at a profit.
It works the same way the other way around as well. If a trader wants to sell they keep an eye on downward trends. They would want to see when the corrective wave for the downward trend ends so that they can sell at that point before the impulse wave carries the price further down where they can buy.

 It is important to note, however, that 61.8% is not the only important figure when looking at retracement. A lot of times the price will retrace only halfway i.e. 50% before going back up. 50% or 0.5 is not a Fibonacci ratio, but for whatever reason it is a recurring retraction point.
When making these decisions, relying on one indicator alone is not the wisest thing. You must take other indicators, such as moving averages into account as well.
Now that we know of a lot of the indicators of price action in the forex market, we can move on to ways of analyzing these to help our trading.
